Build a real-time dashboard
Learn how to build a real-time analytics dashboard from scratch for free using 3 tools: Tinybird, Tremor, and Next.js. The result is a dashboard and enough familiarity with Tremor to adjust the frontend and data visualization for your own projects.
GitHub RepositoryImagine you're a DocuSign competitor. You're building a SaaS to disrupt the document signature space, and as a part of that, you want to give your users a real-time data analytics dashboard so they can monitor how, when, where, and what is happening with their documents in real time.
In this tutorial, learn how to:
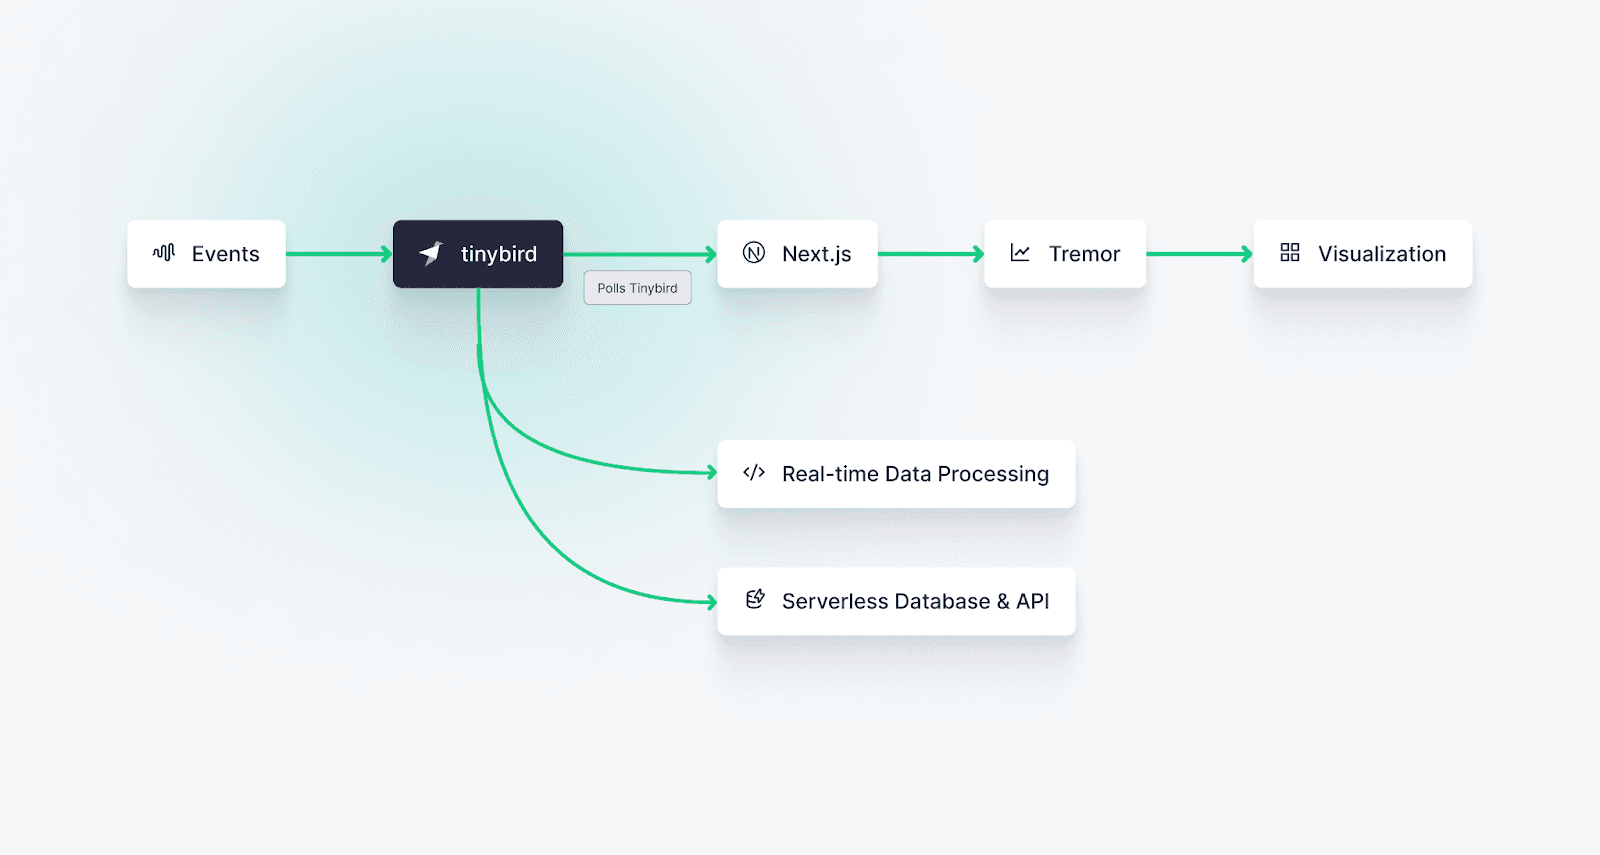
- Use Tinybird to capture events (like a document being sent, signed, or received) using the Tinybird Events API.
- Process them with SQL.
- Publish the transformations as real-time APIs.
- Use Tremor components in a Next.js app to build a clean, responsive, real-time dashboard.
Here's how it all fits together:
Prerequisites
To complete this tutorial, you need the following:
- A free Tinybird account
- Node.js >=18
- Python >=3.8
- Working familiarity with JavaScript
This tutorial uses both the Tinybird web UI and the Tinybird CLI. If you're not familiar with the Tinybird CLI, read the CLI docs or try it. You can copy and paste every code snippet and command in this tutorial. Each step is explained.
1. Create a Tinybird Workspace
Navigate to the Tinybird web UI (app.tinybird.co) and create an empty Tinybird Workspace (no starter kit) called signatures_dashboard in your preferred region.
2. Create the folder structure
In your terminal, create a folder called tinybird-signatures-dashboard. This folder contains all your code. Inside it, create folders to keep things organized:
mkdir tinybird-signatures-dashboard && cd tinybird-signatures-dashboard
mkdir datagen datagen/utils app tinybird
The final structure is:
└── tinybird-signatures-dashboard
   ├── app
   ├── datagen
   │   └── utils
   └── tinybird
3. Install the Tinybird CLI
The Tinybird CLI is a command-line tool for interacting with Tinybird's API. Use it to create and manage the data project resources that underpin your real-time dashboard. Run the following commands to prepare the virtual environment, install the CLI, and authenticate (the -i flag is for "interactive"):
python -m venv .venv
source .venv/bin/activate
pip install tinybird-cli
tb auth -i
Choose the region that matches your Workspace region. If you're not sure which region you chose, select the Workspace name in the Tinybird UI to see the region under your email address. The CLI then prompts you for your user admin Token, which lives in the Tinybird UI under "Tokens". Paste it into the CLI and select Enter.
You're now authenticated to your Workspace from the CLI, and your auth details are saved in a .tinyb file in the current working directory.
Your user admin Token has full read/write privileges for your Workspace. Don't share it or publish it in your app. You can find more detailed info about Static Tokens in the Tokens docs.
Ensure that the .tinyb file and the .venv folder aren't publicly exposed by creating a .gitignore file and adding it:
touch .gitignore
echo ".tinyb" >> .gitignore
echo ".venv" >> .gitignore
4. Create a mock data stream
Now download the mockDataGenerator.js file and place it in the datagen folder.
cd datagen
curl -O https://raw.githubusercontent.com/tinybirdco/demo-user-facing-saas-dashboard-signatures/refs/heads/main/datagen/mockDataGenerator.js
What this file does
The mockDataGenerator.js script generates mock user accounts, with fields like account_id, organization, phone_number, and various certification statuses related to the account's means of identification:
const generateAccountPayload = () => {
    const status = ["active", "inactive", "pending"];
    const id = faker.number.int({ min: 10000, max: 99999 });
    account_id_list.push(id);

    return {
        account_id: id,
        organization: faker.company.name(),
        status: status[faker.number.int({ min: 0, max: 2 })],
        role: faker.person.jobTitle(),
        certified_SMS: faker.datatype.boolean(),
        phone: faker.phone.number(),
        email: faker.internet.email(),
        person: faker.person.fullName(),
        certified_email: faker.datatype.boolean(),
        photo_id_certified: faker.datatype.boolean(),
        created_on: (faker.date.between({ from: '2020-01-01', to: '2023-12-31' })).toISOString().substring(0, 10),
        timestamp: Date.now(),
    }
}
In addition, the code generates mock data events about the document signature process, with variable status values such as in_queue, signing, expired, error, and more:
const generateSignaturePayload = (account_id, status, signatureType, signature_id, since, until, created_on) => {
    return {
        signature_id,
        account_id,
        status,
        signatureType,
        since: since.toISOString().substring(0, 10),
        until: until.toISOString().substring(0, 10),
        created_on: created_on.toISOString().substring(0, 10),
        timestamp: Date.now(),
        uuid: faker.string.uuid(),
    }
}
Lastly, the generator creates and sends a final status for the signature using weighted values:
const finalStatus = faker.helpers.weightedArrayElement([
    { weight: 7.5, value: 'completed' },
    { weight: 1, value: 'expired' },
    { weight: 0.5, value: 'canceled' },
    { weight: 0.5, value: 'declined' },
    { weight: 0.5, value: 'error' },
]) // 7.5/10 chance of being completed, 1/10 chance of being expired, 0.5/10 chance of being canceled, declined or error
Download the helper functions
This script also utilizes a couple of helper functions to access your Tinybird Token and send the data to Tinybird with an HTTP request using the Tinybird Events API. These helper functions are located in the tinybird.js file in the repo. Download that file and add it to the datagen/utils directory.
cd datagen/utils
curl -O https://raw.githubusercontent.com/tinybirdco/demo-user-facing-saas-dashboard-signatures/refs/heads/main/datagen/utils/tinybird.js
The Tinybird Events API is useful for two reasons:
- Use it for flexible and efficient ingestion of data representing various signature stages directly into Tinybird without complex streaming infrastructure.
- Stream events directly from your app instead of relying on batch ETLs or change data capture, which requires logging the events in a transactional database first and can add lag to the data pipeline.
Install the data generator library
Run this command:
cd datagen
npm init --yes
npm install @faker-js/faker
To run this file and start sending mock data to Tinybird, you need to create a custom script in the package.json generated file inside datagen folder. Open up that file and add the following to the scripts:
"seed": "node data-project/mockDataGenerator.js"
Because your code uses ES modules, add "type": "module" to the package.json file to run the script and access the modules. For more information, read this post.
Your package.json should now look something like this:
{
  "name": "datagen",
  "version": "1.0.0",
  "description": "",
  "main": "index.js",
  "type": "module",
  "scripts": {
    "seed": "node ./mockDataGenerator.js"
  },
  "dependencies": {
    "@faker-js/faker": "^8.4.1"
  },
  "license": "ISC",
  "author": ""
}
You're ready to start sending mock data to Tinybird. Open a new terminal tab or window in this local project directory. In the datagen folder, run:
npm run seed
The seed output appears in your terminal. Let this run in the background so you have some data for the next steps. Return to your original terminal tab or window.
Verify your mock data stream
To verify that the data is flowing properly into Tinybird, inspect the Tinybird Data Sources. In the Tinybird UI, navigate to the signatures and accounts Data Sources to confirm that the data has been received. The latest records should be visible.
You can also confirm using the CLI, by running a SQL command on your Data Source:
tb sql "select count() from signatures"
If you run this a few times while your mock data stream is running, the number increases.
This project uses mock data streams to simulate data generated by a hypothetical document signatures app. If your app generates data, skip this step. Add the helper functions to your codebase and call them to send data directly from your app to Tinybird.
5. Build dashboard metrics with SQL
You now have a Data Source: Events streaming into Tinybird, which ensures your real-time dashboard has access to fresh data. The next step is to build real-time metrics using Tinybird Pipes.
A Pipe is a set of chained, composable nodes of SQL that process, transform, and enrich data in your Data Sources.
Create a new Pipe in the Tinybird UI by selecting the + icon in the left-hand nav bar and selecting "Pipe". Rename your new Pipe ranking_of_top_organizations_creating_signatures.
Next, create your first Node. Remove the placeholder text from the Node, and paste in the following SQL:
    %
    SELECT
      account_id,
      {% if defined(completed) %}
        countIf(status = 'completed') total
      {% else %}
        count() total
      {% end %}
    FROM signatures
    WHERE
        fromUnixTimestamp64Milli(timestamp)
        BETWEEN {{
            Date(
                date_from,
                '2023-01-01',
                description="Initial date",
                required=True,
            )
        }}
        AND {{
    Date(
      date_to,
       '2024-01-01',
       description="End date",
        required=True
    )
         }}
    GROUP BY account_id
    HAVING total > 0
    ORDER BY total DESC
Key points to understand in this snippet:
- As well as standard SQL, it uses the Tinybird templating language and query parameters - you can tell when query params are used, because the
%symbol appears at the top of the query. This makes the query dynamic, so instead of hardcoding the date range, the user can now select a range and have the results refresh in real time. - It has an
if definedstatement. In this case, if a boolean tag calledcompletedis passed, the Pipe calculates the number of completed signatures. Otherwise, it calculates all signatures.
Select "Run" to run and save this Node, then rename it retrieve_signatures. Create a second Node and paste in the following SQL:
SELECT
  organization,
  sum(total) AS org_total
FROM retrieve_signatures
LEFT JOIN accounts ON accounts.account_id = retrieve_signatures.account_id
GROUP BY organization
ORDER BY org_total DESC
LIMIT {{Int8(limit, 10, description="The number of rows accounts to retrieve", required=False)}}
Name this node endpoint and select "Run" to save it.
You now have a 2-Node Pipe that gets the top <limit> number of organizations by signatures within a date range, either completed or total depending on whether a completed query parameter is passed or not.
6. Publish metrics as APIs
You're now ready to build a low-latency, high-concurrency REST API Endpoint from your Pipe with 2 selections.
Select the "Create Endpoint" button, then select the endpoint Node.
The API page contains a usage monitoring chart, parameter documentation, and sample usage. The API also uses an automatically generated, read-only Token.
Test your API
Copy the HTTP Endpoint from the "Sample usage" box and paste it directly into a new browser tab to see the response. In the URL, you can manually adjust the date_from and date_to parameters and see the different responses. You can also adjust the limit parameter, which controls how many rows are returned.
If you request the data in JSON format, which is the default behavior, the response also includes metadata such as query latency statistics:
"statistics": {
    "elapsed": 0.001110996,
    "rows_read": 4738,
    "bytes_read": 101594
}
The API response in this example took barely 1 millisecond. When building your own projects, use this metadata and Tinybird's other tools to monitor and optimize your dashboard query performance.
Optional: Pull the Tinybird resources into your local directory
You've created several Tinybird resources: a Workspace, a Data Source, Pipes, and an Endpoint. Pull these resources locally to manage this project with Git.
In your terminal, start by pulling the Tinybird data project:
tb pull --auto
The CLI confirms that it wrote 3 resources (signatures.datasource, accounts.datasource, and ranking_of_top_organizations_creating_signatures.pipe) into the datasources and pipes subfolders created by the --auto flag. Move them into the data-project directory:
cd tinybird
mv datasources pipes tinybird/
As you add additional resources in the Tinybird UI, use the tb pull –auto command to pull files from Tinybird. You can then add them to your Git commits and push them to your remote repository.
If you create data project resources locally using the CLI, you can push them to the Tinybird server with tb push. For more information on managing Tinybird data projects in the CLI, check out this CLI overview.
7. Create real-time dashboard
Now that you have a low-latency API with real-time dashboard metrics, you're ready to create the visualization layer using Next.js and Tremor. These two tools provide a scalable and responsive interface that integrate with Tinybird's APIs to display data dynamically. Plus, they look great.
Initialize the project
In your terminal, create a folder called app and create your Next.js app inside it with this command. This tutorial uses plain JavaScript files and Tailwind CSS:
cd app
npx create-next-app . --js --tailwind --eslint --src-dir --app --import-alias "@/*"
Add the chart library
Use Tremor to create a simple bar chart that displays the signature count for each organization. Tremor provides React chart components that you can deploy and customize as needed.
Install Tremor with the CLI:
npx @tremor/cli@latest init
Select Next as your framework and allow Tremor to overwrite your existing tailwind.config.js.
Add the data fetching library
Use SWR to handle the Endpoint data and refresh it every 5 seconds. SWR handles data caching and revalidation. You can also define a refresh policy. See its documentation for revalidation strategies.
npm i swr
Set up environment variables
Next, you need to add your Tinybird host and user admin Token as environment variables so you can run the project locally. Create a .env.local file in the root directory (/signatures_dashboard) and add the following:
NEXT_PUBLIC_TINYBIRD_HOST="YOUR TINYBIRD API HOST" # Your regional API host e.g. https://api.tinybird.co
NEXT_PUBLIC_TINYBIRD_TOKEN="YOUR SIGNING TOKEN" # Use your Admin Token as the signing token
The API host in the following examples must match your Workspace's region. See the full list of regions and hosts
Set up your page.js
Next.js created a page.js as part of the bootstrap process. Open it in your preferred code editor and clear the contents. Paste in the snippets in order from the following sections, understanding what each one does:
Import UI libraries
To build your dashboard component, import the required UI elements and functions from the libraries at the beginning of your file. The use client; directive renders the components on the client side. For more details, see the Next.js docs.
"use client";

import { BarChart, Card, Subtitle, Text, Title } from "@tremor/react";
import React from "react";
import useSWR from "swr";
Define constants
Inside your main component, define the constants required for this specific component:
// Get your Tinybird host and Token from the .env file
const TINYBIRD_HOST = process.env.NEXT_PUBLIC_TINYBIRD_HOST; // The host URL for the Tinybird API
const TINYBIRD_TOKEN = process.env.NEXT_PUBLIC_TINYBIRD_TOKEN; // The access Token for authentication with the Tinybird API
const REFRESH_INTERVAL_IN_MILLISECONDS = 5000; // five seconds
Connect your dashboard to your Tinybird API
Write a function to fetch data from Tinybird. For brevity, this snippet hardcodes the dates and uses the default limit in the Tinybird API. You could set up a Tremor datepicker, number input, or both to dynamically update the dashboard components from the UI.
export default function Dashboard() {
  // Define date range for the query
  const today = new Date(); // Get today's date
  const dateFrom = new Date(today.setMonth(today.getMonth() - 1)); // Start the query's dateFrom to the one month before today
  const dateTo = new Date(today.setMonth(today.getMonth() + 1)); // Set the query's dateTo to be one month from today

  // Format for passing as a query parameter
  const dateFromFormatted = dateFrom.toISOString().substring(0, 10);
  const dateToFormatted = dateTo.toISOString().substring(0, 10);

  // Constructing the URL for fetching data, including host, token, and date range
  const endpointUrl = new URL(
    "/v0/pipes/ranking_of_top_organizations_creating_signatures.json",
    TINYBIRD_HOST
  );
  endpointUrl.searchParams.set("token", TINYBIRD_TOKEN);
  endpointUrl.searchParams.set("date_from", dateFromFormatted);
  endpointUrl.searchParams.set("date_to", dateToFormatted);

  // Initializes variables for storing data
  let ranking_of_top_organizations_creating_signatures, latency, errorMessage;

  try {
    // Function to fetch data from Tinybird URL and parse JSON response
    const fetcher = (url) => fetch(url).then((r) => r.json());

    // Using SWR hook to handle state and refresh result every five seconds
    const { data, error } = useSWR(endpointUrl.toString(), fetcher, {
      refreshInterval: REFRESH_INTERVAL_IN_MILLISECONDS,
    });

    if (error) {
      errorMessage = error;
      return;
    }
    if (!data) return;

    if (data?.error) {
      errorMessage = data.error;
      return;
    }

    ranking_of_top_organizations_creating_signatures = data.data; // Setting the state with the fetched data
    latency = data.statistics?.elapsed; // Setting the state with the query latency from Tinybird
  } catch (e) {
    console.error(e);
    errorMessage = e;
  }
Render the component
Finally, include the rendering code to display the "Ranking of the top organizations creating signatures" in the component's return statement:
return (
    <Card>
      <Title>Top Organizations Creating Signatures</Title>
      <Subtitle>Ranked from highest to lowest</Subtitle>
      {ranking_of_top_organizations_creating_signatures && (
        <BarChart
          className="mt-6"
          data={ranking_of_top_organizations_creating_signatures}
          index="organization"
          categories={["org_total"]}
          colors={["blue", "red"]}
          yAxisWidth={48}
          showXAxis={true}
        />
      )}
      {latency && <Text>Latency: {latency * 1000} ms</Text>}
      {errorMessage && (
        <div className="mt-4 text-red-600">
          <p>
            Oops, something happens: <strong>{errorMessage}</strong>
          </p>
          <p className="text-sm">Check your console for more information</p>
        </div>
      )}
    </Card>
  );
}
View your dashboard
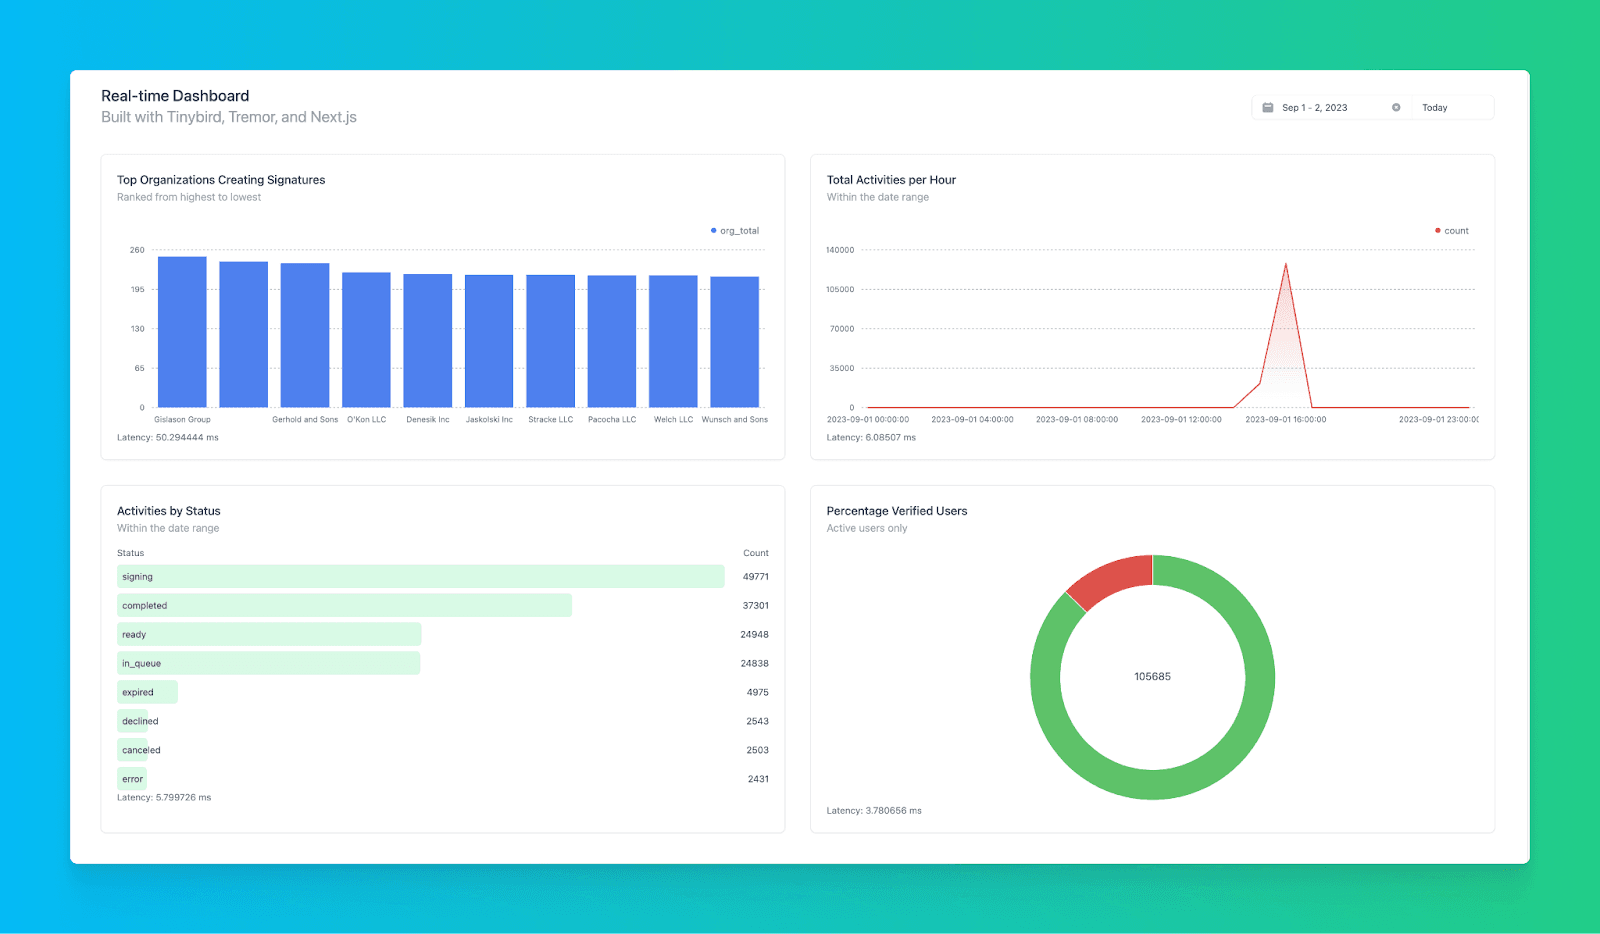
Run npm run dev and navigate to http://localhost:3000/ in your browser. The dashboard looks like this:
You've created a real-time dashboard component using Tinybird, Tremor, and Next.js. Check the latency number under the component to monitor rendering speed. In this example, Tinybird returned the dashboard data in a little over 40 milliseconds while aggregating about a million rows with a relatively unoptimized query.
Optional: Expand your dashboard
You have the basics: an active Workspace and Data Source, knowledge of how to build Pipes, and access to the Tremor docs. Build more Pipes, Endpoints, and visualizations.
You can also spend some time optimizing your data project for faster responses and minimal data processing using fine-tuned indexes, Materialized Views, and more.
Next steps
- Investigate the GitHub repository for this project in more depth.
- Understand today's real-time analytics landscape with Tinybird's definitive guide.
- Learn how to implement multi-tenant security in your user-facing analytics.