Build a user-facing web analytics app with Confluent and Tinybird
Learn how to take data from Kafka and build a user-facing web analytics dashboard using Confluent and Tinybird.
GitHub Repository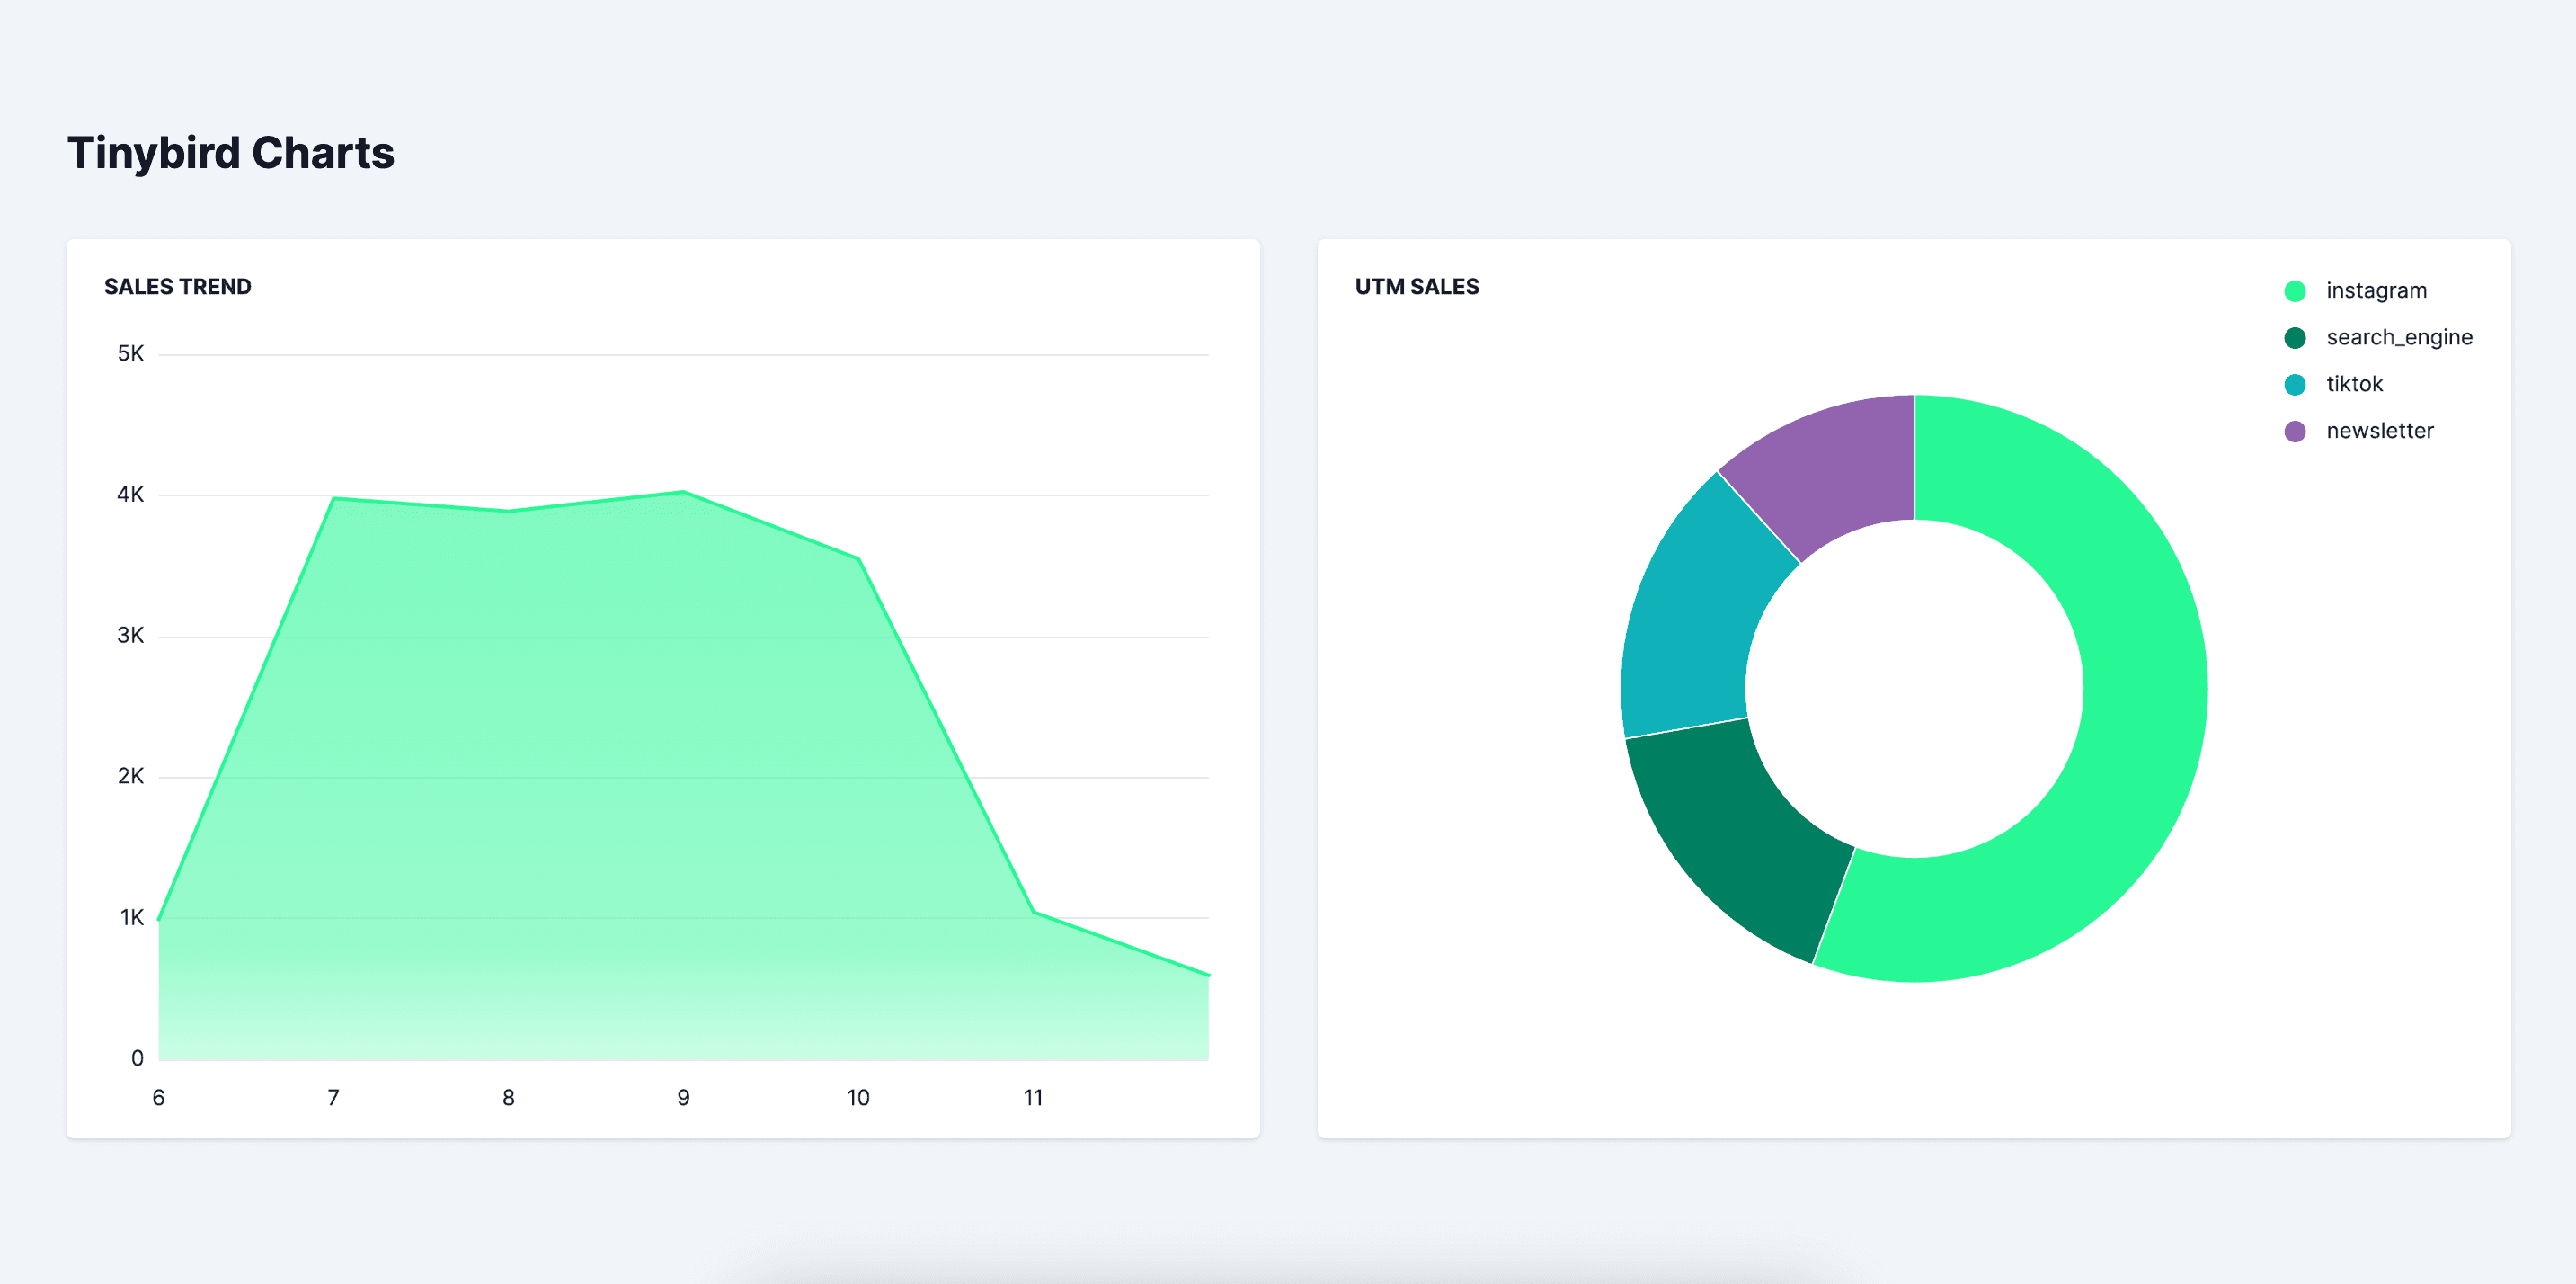
In this tutorial, learn how to:
- Connect Tinybird to a Kafka topic.
- Build and publish Tinybird API Endpoints using SQL.
- Create 2 Charts without having to code from scratch.
Prerequisites
To complete this tutorial, you need:
- A free Tinybird account
- An empty Tinybird Workspace
- A Confluent account
- Node.js >=20.11
This tutorial includes a Next.js app for frontend visualization, but you don't need working familiarity with TypeScript. Copy and paste the code snippets.
1. Setup
Clone the demo_confluent_charts repo.
2. Create your data
Option 1: Use your own existing data
In Confluent, create a Kafka topic with simulated e-commerce events data. Check this file for the schema outline to follow.
Option 2: Mock the data
Use Tinybird's Mockingbird, an open source mock data stream generator, to stream mock web events instead.
In the repo, navigate to /datagen and run npm i to install the dependencies.
Create an .env and replace the default Confluent variables:
cp .env.example .env
Run the mock generator script:
node mockConfluent.js
3. Connect Confluent to Tinybird
In your Tinybird Workspace, create a new Data Source using the native Confluent connector. Paste in the bootstrap server, rename the connection to tb_confluent, then paste in your API key and secret. Select "Next".
Search for and select your topic, and select "Next". Ingest from the earliest offset, then under "Advanced settings" > "Sorting key" select timestamp.
Rename the Data Source to ecomm_events and select "Create". Your Data Source is now ready, and you've connected Confluent to Tinybird. You now have something like a database table and a Kafka consumer combined.
4. Transform your data
Query your data stream
Your data should now be streaming in. In Tinybird, transform data using straightforward SQL in chained nodes that form a Pipe.
Create a new Pipe and rename it sales_trend. In the first node space, paste the following SQL:
SELECT timestamp, sales FROM ecomm_events
WHERE timestamp >= now() - interval 7 day
This gets the timestamp and sales from the last 7 days.
Run the query and rename the node filter_data.
In the second node space, paste the following:
SELECT toDate(timestamp) AS ts, sum(sales) AS total_sales from filter_data
GROUP BY ts
ORDER BY ts
This casts the timestamp to a date as ts, and sums up the sales - meaning you can get a trend of sales by day.
Run the query and rename the node endpoint.
Publish your transformed data
Select "Create API Endpoint" and select the endpoint Node. It's published and ready for use.
5. Create a Tinybird chart
Select "Create Chart".
Rename the chart "Sales Trend" and select and Area Chart. Under the "Data" tab, select ts as the index and total_sales as the category.
The chart appears. Select "Save".
6. Run an app locally
View the component code for the Chart by selecting the code symbol (<>) above it. Copy this code and paste into a new file in the components folder called SalesTrend.tsx.
In page.tsx, replace <p>Chart 1<p> with your new chart <SalesTrend />. Save and view it in the browser with npm run dev. Your chart appears.
Create a second Pipe --> chart
Create a second Pipe in Tinybird called utm_sales:
SELECT utm_source, sum(sales) AS total_sales FROM ecomm_events
WHERE timestamp >= now() - interval 7 day
GROUP BY utm_source
ORDER BY total_sales DESC
This gets sales by utm over the last 7 days.
Run the query and rename the node endpoint. Publish it as an Endpoint, create a Chart, and get the code. This time, create a donut Chart called "UTM Sales" with utm_source as the index and total_sales as the category.
Check the "Legend" box and play around with the colors to create clear differentiators.
Create a new component file called UTMSales.tsx and import it in page.tsx, replacing chart 2.
Next steps
- Read more about Tinybird charts.
- Use Charts internally to monitor latency in your own Workspace.