Add charts to a Next.js frontend
Learn how to create Tinybird Charts from the UI and add them to your Next.js frontend.
Tinybird Charts make it easy to visualize your data and create interactive charts. You can create a Chart from the UI and then embed it in your frontend app. This guide shows you how to add Tinybird Charts to a Next.js frontend.
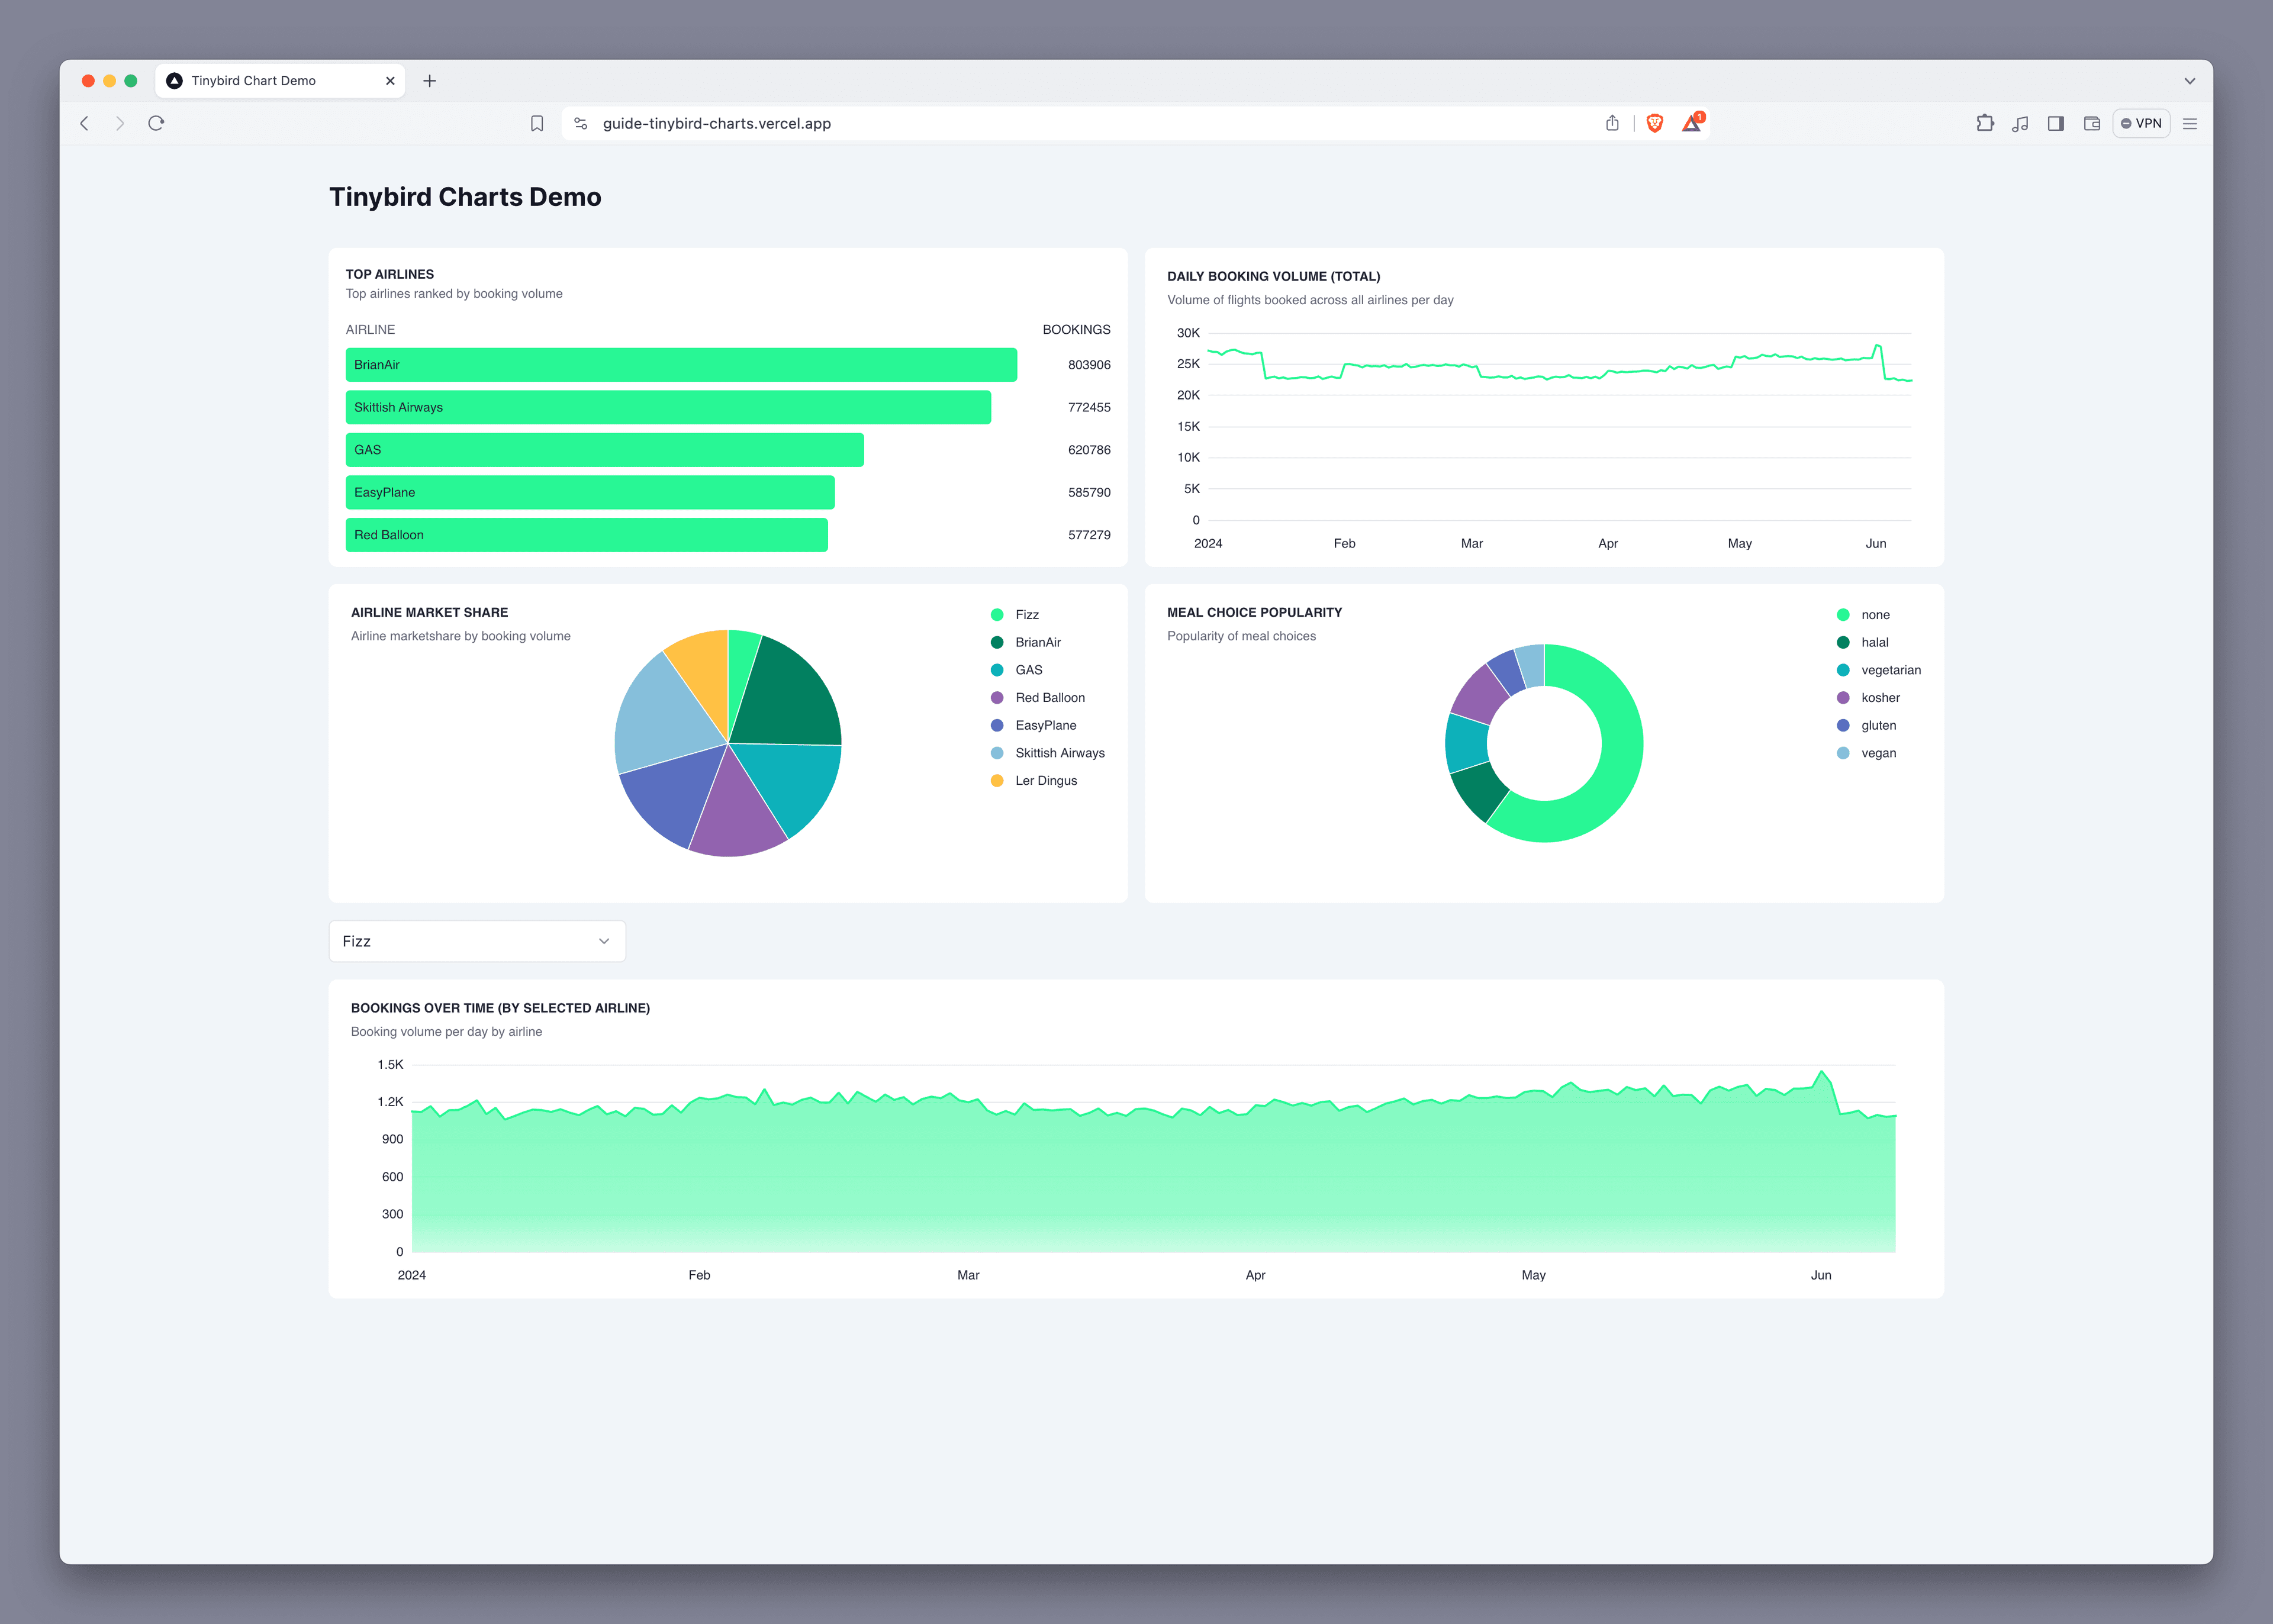
You can view the live demo or browse the GitHub repo (guide-tinybird-charts).
Prerequisites
This guide assumes that you have a Tinybird account, and you are familiar with creating a Tinybird Workspace and pushing resources to it.
You need a working familiarity with JavaScript and Next.js.
Run the demo
These steps cover running the GitHub demo locally. Skip to the next section to build the demo from scratch.
1. Clone the GitHub repo
Clone the GitHub repo (guide-tinybird-charts) to your local machine.
2. Push Tinybird resources
The repo contains a tinybird folder which includes sample Tinybird resources:
events.datasource: The Data Source for incoming events.airline_market_share.pipe: An API Endpoint giving a count of bookings per airline.bookings_over_time.pipe: An Endpoint giving a time series of booking volume over time.bookings_over_time_by_airline.pipe: An Endpoint giving a time series of booking volume over time with anairlinefilter.meal_choice_distribution.pipe: An Endpoint giving a count of meal choices across bookings.top_airlines.pipe: An Endpoint giving a list of the top airlines by booking volume.
Make a new Tinybird Workspace in the region of your choice. Then, configure the Tinybird CLI (install and authenticate) and tb push the resources to your Workspace. Alternatively, you can drag and drop the files onto the UI to upload them.
3. Generate some fake data
Use Mockingbird to generate fake data for the events Data Source.
This link provides a preconfigured schema. Enter your Workspace Admin Token and select the Host region that matches your Workspace. When configured, select Save, then select Start Generating!.
In the Tinybird UI, confirm that the events Data Source is successfully receiving data.
4. Install dependencies
In the cloned repo, navigate to /app and install the dependencies with npm install.
5. Configure .env
First create a new file .env.local
cp .env.example .env.local
From the Tinybird UI, copy the read Token for the Charts. If you deployed the resources from this repo, its name is CHART_READ_TOKEN. Paste the Token into the .env.local file in your directory:
NEXT_PUBLIC_TINYBIRD_STATIC_READ_TOKEN="STATIC READ TOKEN"
Run the demo app
Run it locally:
npm run dev
Then open localhost:3000 with your browser.
Build from scratch
This section takes you from a fresh Tinybird Workspace to a Next.js app with a Tinybird Chart.
1. Set up a Workspace
Create a new Workspace. This guide uses the EU GCP region, but you can use any region.
Save this .datasource file locally and upload it to the Tinybird UI. Drop the file into the UI or use Create new (+) to add a new Data Source.
You now have a Workspace with an events Data Source and specified schema. Generate data to fill the Data Source.
2. Generate some fake data
Use Mockingbird to generate fake data for the events Data Source.
This link provides a preconfigured schema. Enter your Workspace Admin Token and select the Host region that matches your Workspace. When configured, select Save, then select Start Generating!.
In the Tinybird UI, confirm that the events Data Source is successfully receiving data.
3. Create and publish an Endpoint
In the Tinybird UI, select the events Data Source and then select Create Pipe.
In the new Pipe, change the name to top_airlines.
In the first SQL Node,paste the following SQL:
    SELECT
        airline,
        count() as bookings
    FROM events
    GROUP BY airline
    ORDER BY bookings DESC
    LIMIT 5
Name this node endpoint and select Run.
Now, publish the Pipe by selecting Create API Endpoint and selecting the endpoint Node. You now have a published Endpoint.
4. Create a chart
Publishing the Endpoint takes you to the Endpoint overview page.
Scroll down to the Output section and select the Charts tab.
Select Create Chart.
On the General tab, set the name to Top Airlines then choose Bar List as the Chart type.
On the Data tab, choose the airline column for the Index and check the bookings box for the Categories.
Select Save.
5. View the Chart component code
After saving your Chart, the Endpoint overview page shows your Chart in the Output section.
To the view the component code for the Chart, select the code symbol (<>) above it. You'll see the command to install the tinybird-charts library as well as the React component code.
6. Create a new Next.js app
On your local machine, create a new working directory and navigate to it. For this example, it's called myapp.
mkdir myapp
cd myapp
In the myapp dir, create a new Next.js app with the following command:
npx create-next-app@latest
Some prompts to configure the app appears. Use the following settings:
✔ What is your project named? … tinybird-demo
✔ Would you like to use TypeScript? … No / [Yes]
✔ Would you like to use ESLint? … No / [Yes]
✔ Would you like to use Tailwind CSS? … No / [Yes]
✔ Would you like to use `src/` directory? … No / [Yes]
✔ Would you like to use App Router? (recommended) … No / [Yes]
✔ Would you like to customize the default import alias (@/*)? … [No] / Yes
After creating the app, navigate to the app directory. Its name matches the project name you entered, tinybird-demo in this example.
cd tinybird-demo
7. Add the Tinybird Charts library
Add the Tinybird Charts library to your project
npm install @tinybirdco/charts
8. Add the Chart component
Create a new subfolder and file src/app/components/Chart.tsx. This file contains the component code for the Chart.
Copy the component from the Tinybird UI and paste it here. It should look like this:
'use client'

import { BarList } from '@tinybirdco/charts'

export function TopAirlines() {
  return (
    <BarList
      endpoint="https://<your_host>/v0/pipes/top_airlines.json"
      token="...token..."
      index="airline"
      categories={['bookings']}
      colorPalette={['#27F795', '#008060']}
      borderRadius="8px"
      title="Top Airlines"
      height="500px"
      padding="16px"
    />
  )
}
Save the file.
9. Add the Chart to your page
In your src/app/page.tsx file, delete the default contents so you have an empty file.
Then, import the TopAirlines component and add it to the page:
import { TopAirlines } from "./components/Chart";

export default function Home() {
  return (
    <div>
      <TopAirlines />
    </div>
  )
}
10. Run the app
Run the app with npm run dev and open localhost:3000 in your browser.
11. Finish the setup
You've successfully added a Tinybird Chart to a Next.js frontend.
Your Next.js frontend should now show a single bar line Chart. See the live demo and browse the GitHub repo (guide-tinybird-charts) for inspiration on how to combine more Chart components to make a full dashboard.
Next steps
- Interested in dashboards? Explore Tinybird's many applications in the Use Case Hub.